Home

>

Examples

Line follower

A line follower example for stock Leo Rover

Prerequisites

No items found.

Home

>

Examples

Line follower

A line follower example for stock Leo Rover

In this example, we will show you how to run a line follower on the Leo Rover mobile robot.

What to expect?

After completing this tutorial, your rover should be able to navigate a two-lined track by itself. You will also be able to gather and train neural network model for this task on your own data. Here's an example of our rover driving on the designated track:

Prerequisites

No items found.

List of components

General requirements

  1. Basic knowledge about ROS (e.g how to run nodes, roslaunch and rosrun commands)
  2. Computer with Linux OS with ROS installed
  3. Stock Leo Rover

For running our model (driving rover on track)

  1. Insulating tape of any color (the more contrast with the ground, the better)

For gathering and training on your data

  1. Account on a website providing online environment for Jupyter Notebooks (we have used kaggle)
  2. Game pad for gathering the data (not needed but recommended)

Mechanical integration

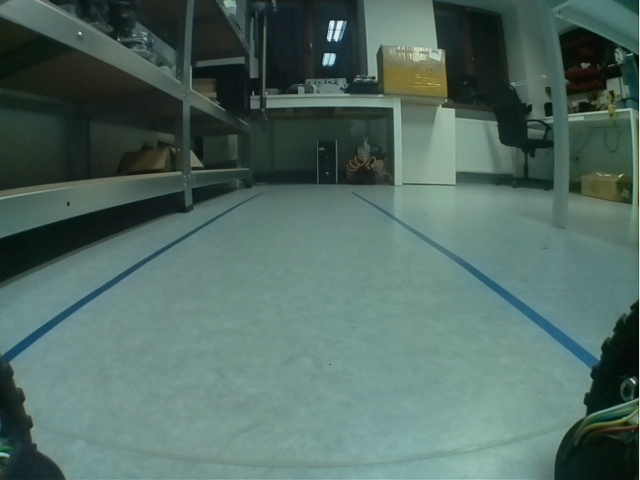
As this is one of our examples for stock Leo Rover, you don't have to do any mechanical stuff regarding the rover. The only "mechanical" thing you need to do is to make a two-lined track with insulating tape. Below, there's an example of our track that we used for training the neural network model – image taken from the rover. Try to end up with something like this:

  • two lines far enough from each other, so that the rover can drive inbetween
  • color of the lines different from the ground
image from Leo Rover showing our track
Actually you don't need to use insulating tape. As you will learn later in the tutorial, you only need to provide two lines for the rover, which have different color than the ground. So for example one solution is drawing/printing the lines on paper and stick it to the ground with adhesive tape.

Wiring and electronics connection

Software integration

Since LeoOS 1.1.0 release, leo_examples package is installed by default. If the system is updated to at least 1.1.0 release you can skip software integration part.
To complete those steps, you need to connect to the rover's network first, and then log in using ssh (both covered in prerequisites).
One package in the leo_examples repository depends on ar_track_alvar package. As there is no release for the ROS version running on the rover (noetic) yet, you have to insatll it manually. To do so, type:

Our neural network model was converted to TensorFlow Lite, so you need to install it on your rover too:

Installing using apt

You can install the package using apt by typing on the rover

Then you just need to source the ros workspace

Building from source

You can also get all needed software from our leo_examples github repository. You need to clone it on the rover in the ros workspace directory (if there's no such a directory, then, first go through the ROS Development tutorial):

Now, you need to install all the dependencies for the downloaded packages:

Then, you need to source the directory and build the packages:

If your installation went without any errors, then you have successfully installed required software.

Examples

Running nodes

Color Mask

Our approach for this task was to get the specified color from the image (color of the tape), and train the neural network on such a mask.

example color mask from our track

So, the first thing you need to do is to get the color mask values. We have prepared ROS node for this task. To run it, type in the terminal on the rover:

Then, on your computer, you need to go to your ROS workspace, source it and export ROS environment variables to be able to run ROS nodes on your computer with master being on the rover:

Now, with the color_mask node running on the rover, run rqt on your computer to be able to visualize the color mask and choose the values:

Now, run in rqt:

  • Image View (Plugins -> Visualization -> Image View)
  • Dynamic Reconfigure (Plugins -> Configuration -> Dynamic Reconfigure)

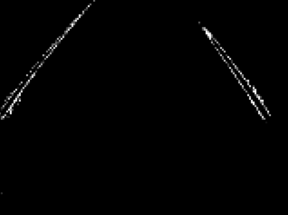
In Image View, from the topic drop down choose /color_mask topic – this is the live view of the color mask sampled from the rover's view with current values for the color mask.

In Dynamic Reconfigure, choose color_mask_finder. You'll see something like this:

rqt setup for choosing color mask

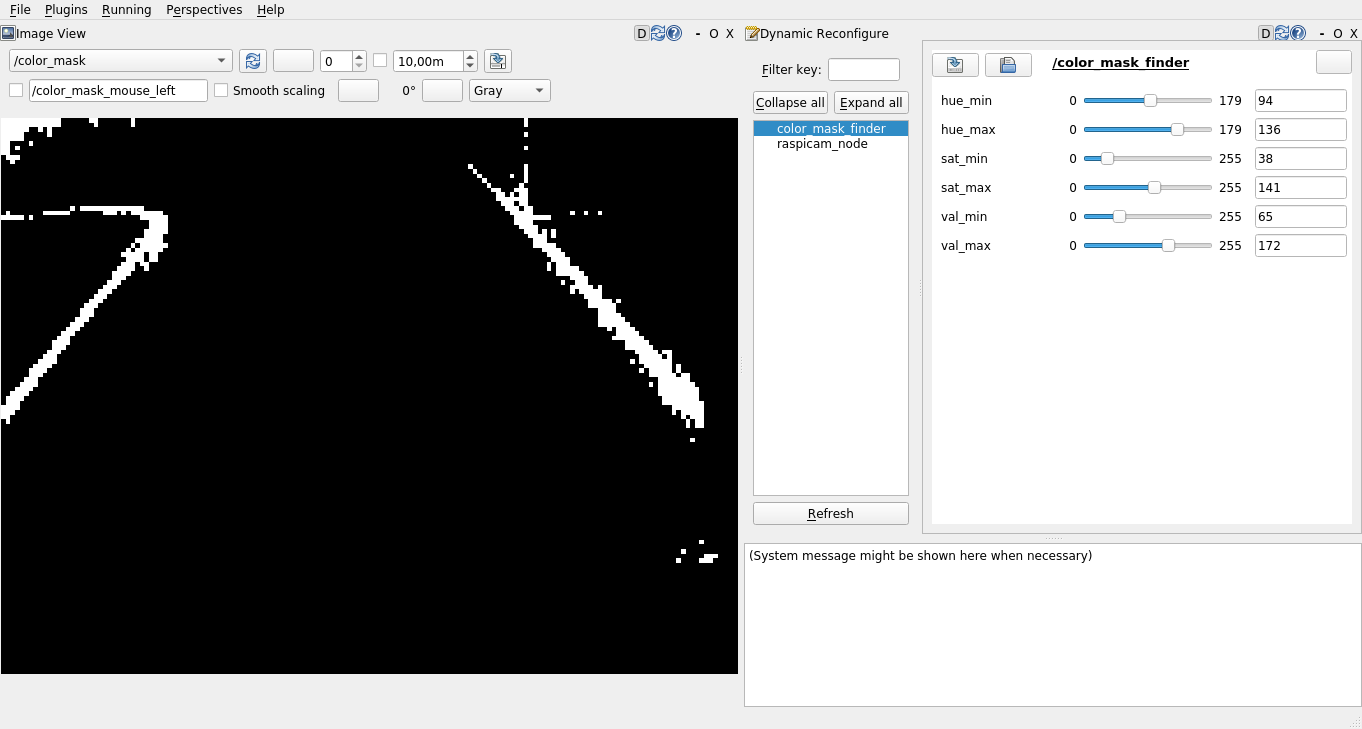
The sliders are for choosing HSV min and max values (2 sliders per hue, saturation and value). You can adjust those sliders to change the color mask. If you want to see what colors are currently in the mask,  switch the topic in the image view to /catched_colors/compressed.

  • When choosing the color mask values from scratch, start by moving all MIN sliders to 0, and all MAX sliders, to maximum values. Then adjust the sliders one by one, until the only white thing in the mask is your track (tape).
  • Color mask visible in rqt is already the image that will be fed to neural network - image is already preprocesed (cropped, etc.)
  • starting values in the dynamic reconfigure are loaded from the yaml file from config directory (default is blue.yaml) which you can specify with ROS launch argument file providing path to the yaml file (you just need to add to the roslaunch command file:=<path>).
  • The node supports overlapping of hue interval (setting hue_max < hue_min). In such situation, your final mask is an union of two masks, where one has hue values from interval [0, hue_max] and the other has values from interval [hue_min, 179] (such solution is usefull for catching colors with wide hue spectrum - e.g. red)

When you are satisfied with your color mask, you can stop both rqt and the node (with ctrl +c). Your chosen values will be printed in the terminal.

color mask values printed on the killing of the node

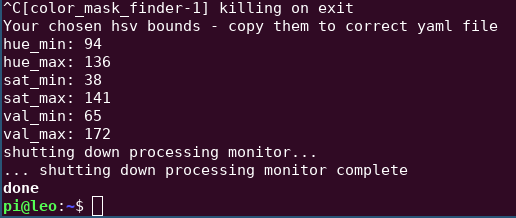
You need to save them in the yaml file (best if you place it in the config directory of the leo_example_line_follower package). You can do this with nano. Copy the printed values (using the mouse or ctrl + shift + c) and type on the rover

Then, paste the values (ctrl + shift + v or use the mouse), save the file (ctrl + o) and close it (ctrl + x).

Line Follower

Running the model is really simple. Just put the rover on the track, and write in terminal (on the rover)

But there are a few roslaunch arguments provided to run the model with your data (e.g. color mask)

The most important ones are as follows:

  • color_mask_file – path to file with the color mask (HSV) values
  • pub_mask – flag specifying whether or not to publish color mask while driving (might slow the payload but useful for debugging)
  • model – path to neural network model (there is a models directory with couple models prepared by us, which you can choose from)

Every argument is documented, you can see all arguments and the documentation by running

Every argument has default value, so you don't need to enter every argument when running the line follower.
When you want to change the value for specific argument, you can do this by adding to the command <arg_name>:=<value>.

So, an example command could look like this:

Remember that due to light reflection from the ground, the rover won't stay on the track forever, so make sure you are ready to stop it, or help it, when it goes off the track.

What next?

Making your own model

Gathering data

For gathering the data, you'll need to run our node data_saver.py. You need to run it on the rover by using the roslaunch command.

The node has one required argument – duration which specifies how long (in seconds) the data will be recorded. You can also specify the output directory for the recorded data using the output_dir argument. So, for example, your command can look like this:

This will record data for 30 seconds and place all the recorded data in the test_drive directory (the node will create the directory if it doesn't exist).

You don't have to record all the data into one directory. You can record the data to many directories, as you will need to process them later anyway. So you can run this command multiple times with changed arguments.

First, the node waits for twist messages from /cmd_vel topic, and after it gets any message from this topic, it'll start recording data (the only data that will be recorded is when the rover is moving – if you're staying in place, no data will be recorded).

After recording the data, in your output directory, you'll find images saved from the rover, and one file labels.txt. The file contains multiple lines of format img_name:label, where the label is a tuple of two floats representing linear and angular (respectively) speeds of the rover in the situation visible in the specified image.

This is the only part, where you might need game controller. It's just easier to drive over track, and stay in the lines - collect good data for the neural network - with game controller, than the joystick on the web page, but you can still do this using the Leo UI.
If the name for output directory, that you have provided is not an absolute path (starting with "/"), the directory will be put under home directory (by default /home/pi). If you want it to be somwhere else, you need to give the absolute path.

Preparing the data

When you have your data recorded, you have to collect it in the correct structure. To do so, you need to run our prepare_data.py node with the rosrun command.

The node has three flags which you have to specify:

  • -t / --train_data – paths to directories with data for training the neural network
  • -v / --valid_data – paths to directories with data for validation during the training
  • -z / --zip_file – name of the zip file with your data that will be created in the end

So, for example, your command can look like this (if you're running it in the home directory):

Unlike roslaunch, rosrun commands run in your current working directory, so for example:
If you run the node in /home/pi/test directory and provide names for the -t and -v flags as train and valid, then the node will look for /home/pi/test/train and /home/pi/test/valid directories.

After running this node, in the same directory, you'll have your zip file with the processed data that is ready to upload to your notebook.

As we have used kaggle, we know that providing zip file is enough for the dataset as it get's unpacked automatically. If you use other platform you may need to unpack the files by hand.

Training the data

This part might be a bit different if you use different platform than kaggle (regarding uploading a file), but most of them will be similar, as you may need to change some lines of code, and run some cells.

Having your data ready, you need to upload it to your notebook. You get a copy of our notebook when cloning repository, but you can also get it under this link.

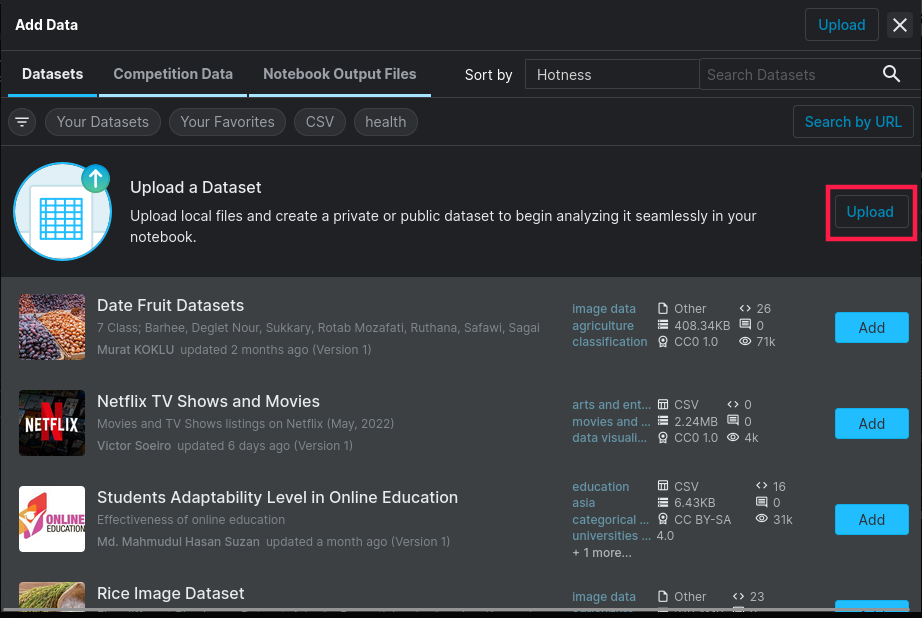
Once you have the notebook, you can upload the data using the Add data button in the upper-right corner.

Then, just click on the Upload button, and drag your zip file (you also need to provide a name for the dataset).

kaggle add data screen
You can also use our dataset. After going to Add data section type in the search bar (upper-right corner) "LeoRover" and you will see, our dataset. Click blue Add button, and the dataset will be added to your notebook.

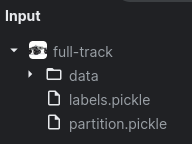
Once it's uploaded to the notebook, you should see something like this:

kaggle input screen shot

Now, you just have to run all the cells up to the "Custom tests" section to begin the training.

There is one cell, with variables that might need to change. Each of them has provided description in a comment. Go through before running, and check if you need to change something.

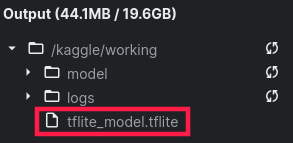
When the training is finished, you'll see your tflite model (the name may differ if you've changed the correct variable in the correct section) in the output section.

kaggle screen of output section

The only thing that you need now is to download the file and place it on the rover. You can download the model by clicking the three dots that show up when you go with the cursor over the file.

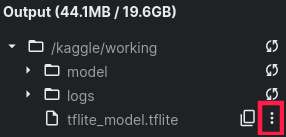
Then, just press Download and the model will be downloaded. Now, you have to place it on the rover, you can follow the instructions from this tutorial.

In the last section, notebook provides two functions to visualize model features. Using them, you can visualize kernels from convolutional layers and feature maps. Both functions are documented in the notebook, so just read them to see all their parameters
Contents

Need help? Contact us - contact@fictionlab.pl